Dashboards
A simplified view of your site on one page.
Insight Dashboard
A visualization tool that transforms, displays, and organizes a collection of data captured and transmitted by your controller. The primary purpose of the Insight dashboard is to provide human-readable information at a glance to remotely monitor historical and live filter data.
Settings for the dashboard
- Time range selector – You can select the time frame for the visible dashboard. According to the time, the frame dashboard will adjust the data. With the
+&-marks you can adjust the time range by zooming in and out
- Dashboard refresh –
You can refresh the selected time-frame data by clicking this icon.

- Dashboard Properties–
You can select the time zone for the dashboard. If you select the
Use site time zoneit will automatically select time according to the site’s time zone. - Preview– Preview your new settings before you save the new dashboard.
- Print– Print your dashboard or save it as a PDF.
- Fullscreen– View your dashboard in fullscreen mode. This function makes the page fit for a presentation or a monitoring room.
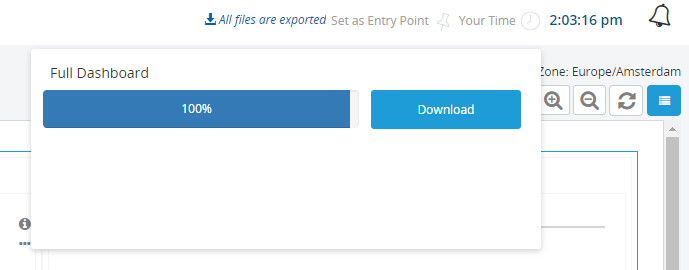
- Export CSV– Export your dashboard sensor data to a CSV file.
Types of available standard dashboards components
Dashboard for an MCP filter
Dashboards are the one of main functions of the Insight platform. Dashboards will give you a simple data analysis view. The dashboard contains laconic visual data which makes daily data processing a simpler task to handle. An insight dashboard with comprehensive multi-layered data allows managers to make faster and more informed decisions.
System information
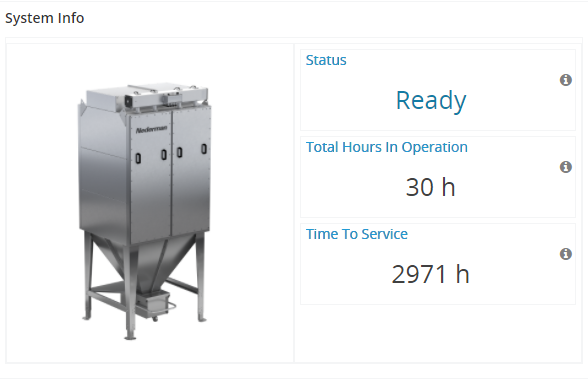
- Live data about your filter energy consumption.
- Quick insight on your device,
To get more information on the sensor you can click on the ℹ️ icon.
To see the live data and graphical chart click on the 🔗 icon end of the status bar.
Read more about the smart data aggregation →
From the dashboard, you can get all the sensor data and rules that were created under the sensor. Then you can get all the critical data from one place, visualize and export them as raw data.
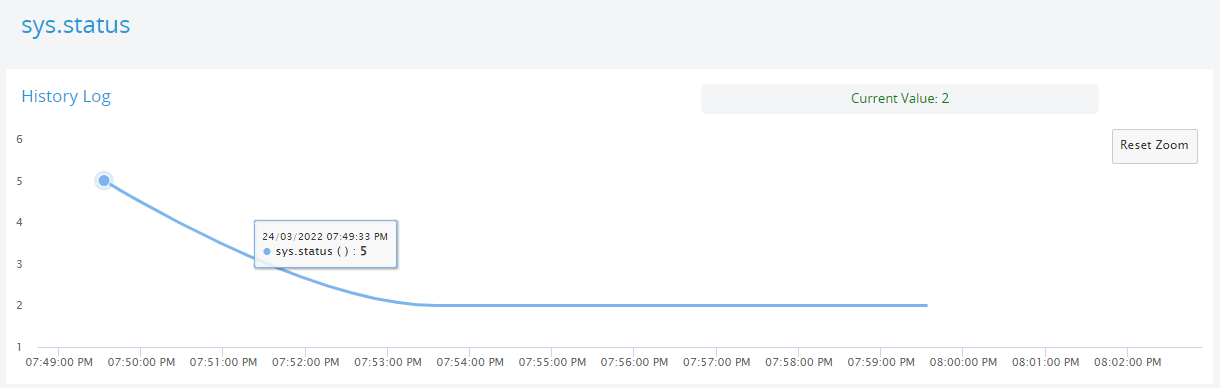
The sensor detail page is a graphical overview of your hardware that shows its Current Value, Historical Log, Data picker, and Chart Status bar.
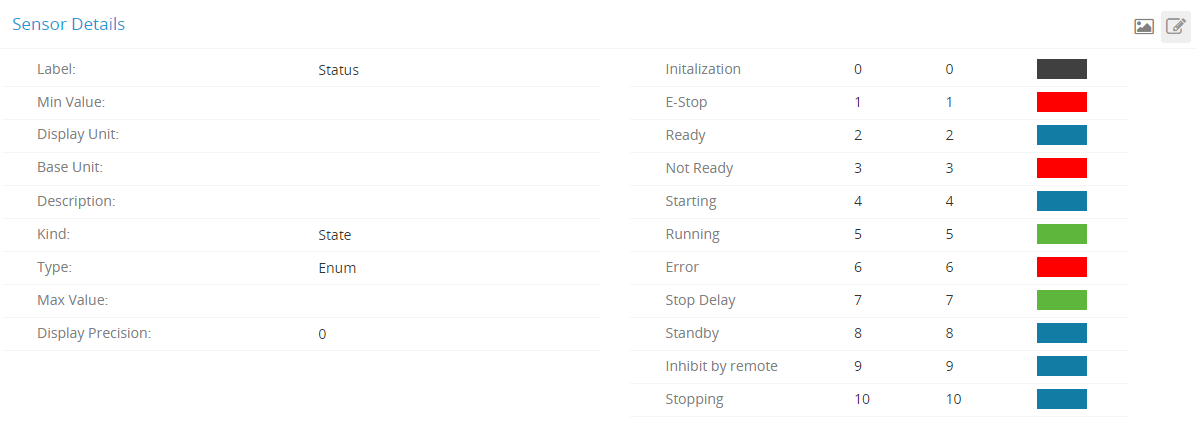
Example detail page of a sensor.
Here you can get all the information regarding the sensor detail. You can see the color scheme for the sensor status.
Filtration
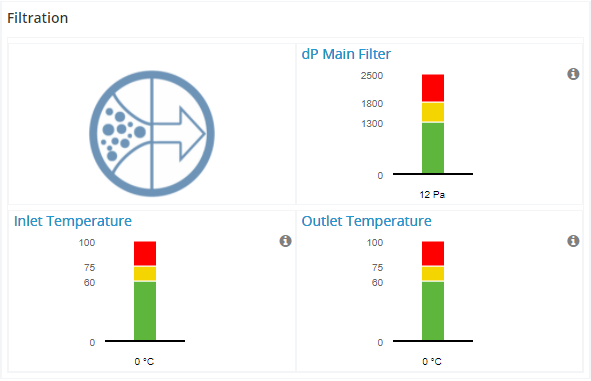
- Live data about your filtration. Having an insightful dashboard with comprehensive multi-layered data allows managers to make faster and more informed decisions.
Alerts and Alarms
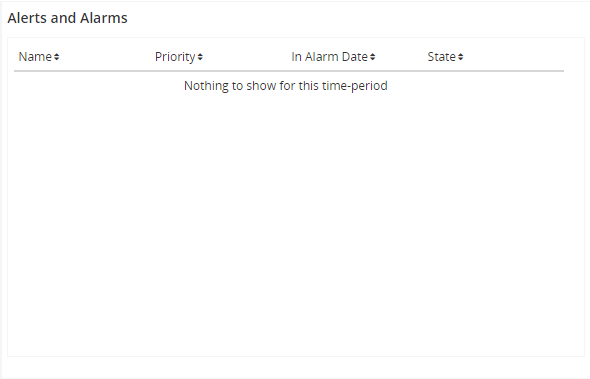
- A table summarizing all your alarms into columns you can select to display
Fan Information
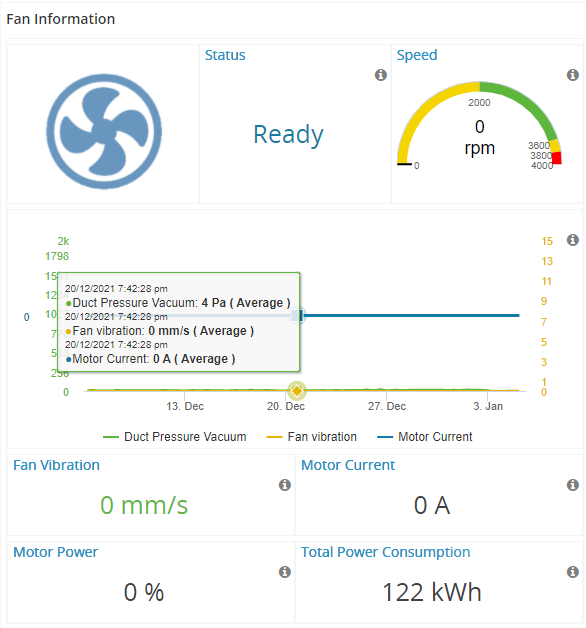
Example showing Fan information
Filter Cleaning
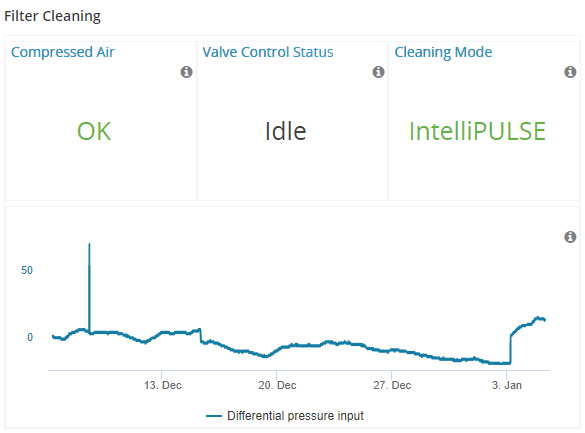
Example showing filter cleaning
Discharge
Example showing discharge